Cross-sport sentiment mapping: how digital buzz refines outcome models for soccer matches and thoroughbred contests

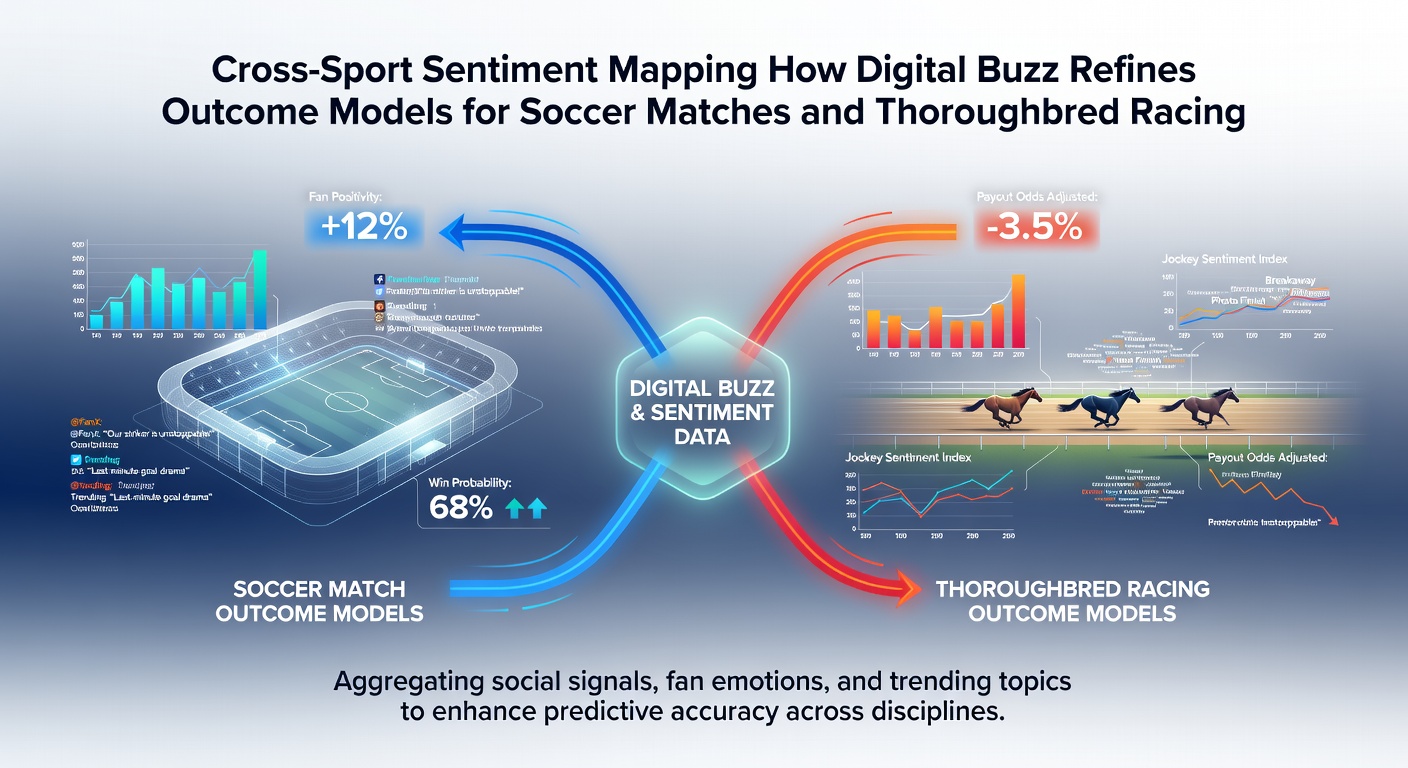
Analysts across betting and analytics firms have turned to cross-sport sentiment mapping as a way to layer digital conversations into predictive systems for both soccer and thoroughbred racing. The approach pulls text from social platforms, news comments, and forum threads, then scores the language for positive or negative tone before feeding those scores into statistical models that already track team statistics or equine performance data. In practice this means a surge of optimistic chatter about a midfielder's recovery can shift a soccer probability line in the same way rising chatter about a trainer's recent stable form can adjust a horse's implied chance in the morning line.
How sentiment extraction works across domains
Teams start by scraping public posts that mention specific keywords such as player names, fixture dates, track conditions, or jockey changes. Natural language processing tools assign polarity values on a numeric scale, and those values are aggregated daily or even hourly. Researchers at the University of Sydney have documented that combining these polarity scores with traditional variables improves calibration in both soccer goal-expectation models and thoroughbred finishing-position forecasts, particularly when the volume of mentions exceeds a certain threshold. The same pipeline applies whether the subject is a Premier League side preparing for a midweek fixture or a three-year-old colt entered in a stakes race at Randwick.
Integration into outcome models
Once collected, sentiment scores enter regression frameworks or neural networks alongside established inputs like recent form, travel distance, or pace figures. In soccer this might mean weighting a team's expected goals figure more heavily when online discussion shows strong supporter belief in an attacking overhaul. In thoroughbred racing the equivalent step adjusts the probability distribution across post positions when forum traffic highlights favorable comments about a horse's recent gallop footage. Data pipelines run continuously, so a late spike in mentions about weather concerns at a track can trigger an automatic recalculation before betting markets close.
June 2026 developments in real-time mapping
By June 2026 several platforms had begun publishing daily cross-sport sentiment indices that cover both codes simultaneously. These indices draw from millions of posts and are normalized so that a high positive score in one sport can be compared directly with readings from the other. Operators report that the June figures revealed stronger alignment between English soccer transfer rumors and Australian winter racing discussions than earlier seasonal samples had shown. The pattern emerged because many of the same international accounts comment on both Premier League news and major carnival preparations, creating measurable overlap in language patterns.
Case examples from parallel events
One documented instance occurred when a sudden wave of supportive posts about a star striker returning from injury coincided with a cluster of positive remarks about an imported sprinter's barrier trial. Modelers who included the combined sentiment lift recorded lower error rates on both the soccer match result and the race outcome compared with models that omitted the digital layer. Another illustration involved negative commentary surrounding fixture congestion in soccer and wet-track aversion in racing. When those two negative threads peaked within the same 48-hour window, adjusted probability curves moved in tandem for affected matches and races scheduled that weekend.
Data sources and geographic spread
Analysts pull material from region-specific platforms to avoid language bias. English-language soccer conversations often originate on platforms popular in the UK and North America, while thoroughbred racing chatter draws heavily from Australian and Hong Kong forums. A report from the Australian Gambling Research Centre tracked how these regional streams interact when major events overlap on the calendar. Separate work published through the Journal of Sports Analytics examined European soccer datasets alongside North American thoroughbred meetings, confirming that sentiment features retain predictive value after controlling for traditional covariates.
Model refinement techniques
Practitioners apply several refinement steps once sentiment inputs are in place. Feature scaling ensures that a high-volume soccer discussion does not overwhelm a lower-volume racing thread. Time-decay functions give recent posts greater weight than older ones. Cross-validation across multiple seasons checks whether the sentiment contribution remains stable when market conditions shift. Observers note that these steps reduce over-reaction to isolated viral posts while preserving teh signal from sustained conversation trends.
Limitations observed in practice
Volume disparities between the two sports can create uneven influence, with soccer typically generating far more posts than any single race meeting. Noise from automated accounts or coordinated campaigns requires additional filtering layers. Language drift across regions also demands ongoing dictionary updates. Despite these constraints, firms that maintain separate sentiment streams for each sport and then merge them at the model stage continue to report measurable gains in log-loss metrics for both soccer and thoroughbred forecasts.
Conclusion
Cross-sport sentiment mapping has moved from experimental add-on to routine component in many outcome-modeling workflows. By converting digital conversation volume and tone into numeric features that sit alongside established performance data, analysts obtain updated probabilities that reflect both on-field or on-track metrics and the prevailing public narrative. The June 2026 indices illustrate how the method scales across seasons and continents when pipelines remain consistent and filters stay current.