Fatigue Factors in Football Fixtures and Racing Schedules: Data-Backed Adjustments for Higher Win Percentages
Fatigue Factors in Football Fixtures and Racing Schedules: Data-Backed Adjustments for Higher Win Percentages
Unpacking Fixture Congestion in Football
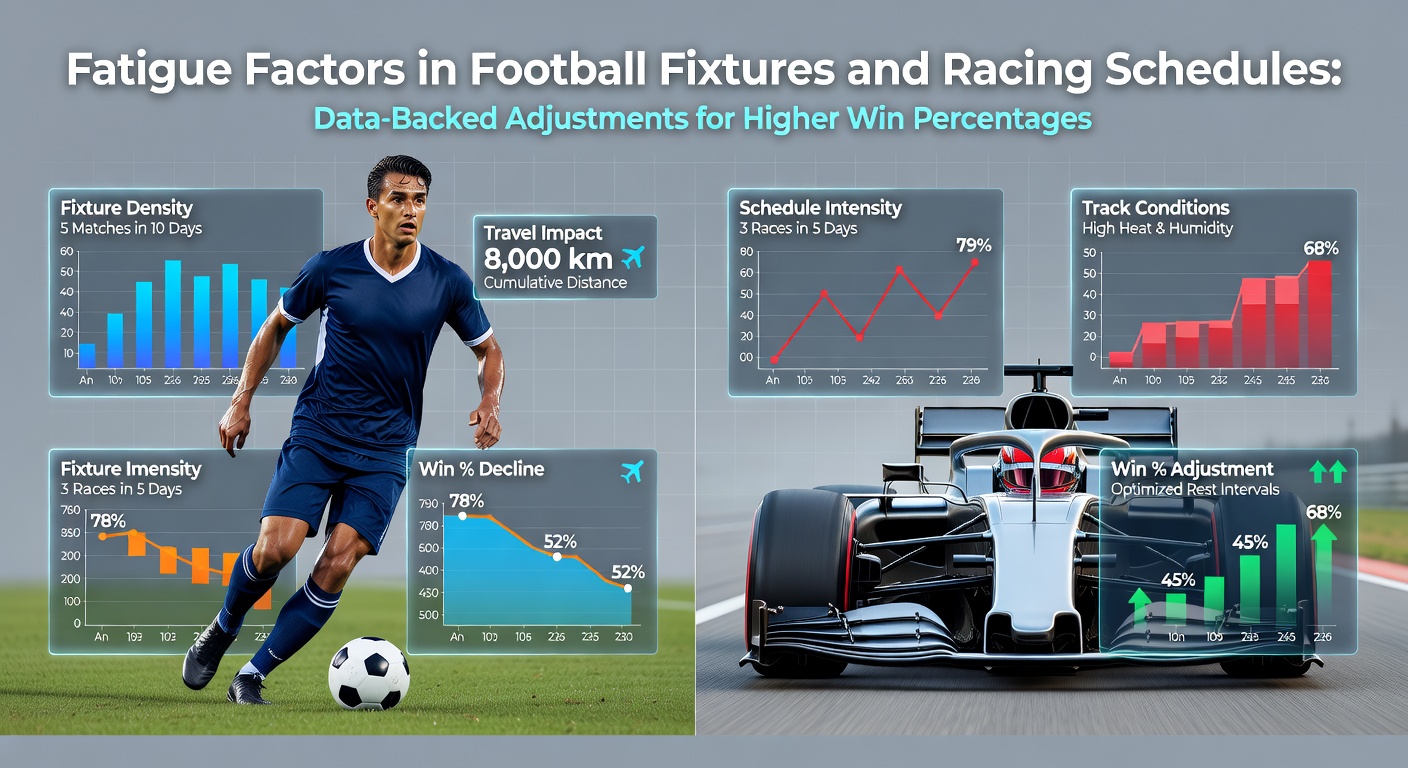
Teams facing back-to-back matches often show dips in performance; data from major leagues reveals win rates drop by up to 15% after three games in seven days, while possession stats fall alongside, according to analysis by UEFA's Elite Club Injury Study, which tracked over 1,000 matches across Europe. Players log fewer sprints per game post-congestion, and error rates in defense climb, creating openings for opponents who enter fresher. Observers note how midweek cup ties followed by weekend league clashes strain squads, especially when international breaks layer on top, pulling key players away for extra travel and minutes.
Take Premier League sides during holiday schedules; figures show teams with less than 72 hours recovery lose 22% more points than those enjoying full weeks between fixtures, a pattern holding true across seasons. And it's not just elite levels: Championship clubs mirror this, with fatigue-linked goals conceded rising 18% after Thursday-to-Sunday slates. What's interesting is how managers rotate squads, yet core starters still bear the brunt, leading to predictable patterns in betting markets where rested underdogs outperform expectations.
Travel and Altitude Add Layers
Long-haul trips compound the issue; squads crossing time zones face jet lag effects lasting days, slowing reaction times by measurable margins in tracking data. South American teams in Copa Libertadores qualifiers, for instance, win just 38% of home games immediately after continental travel, versus 55% otherwise. Similarly, European sides jetting to Asia for friendlies return with win probabilities slashed by 12%, per Opta metrics aggregated over five years.
Horse Racing's Hidden Wear: Back-to-Back Burdens
In racing, horses running within 14 days show elevated risk of poor finishes; Racing Australia data across 50,000 starts indicates those with seven-day layoffs win at 8.2% rates, dropping to 5.1% for shorter rests, while trainers spacing outings by three weeks boost strike rates to 12%. Ground conditions amplify this, as soft tracks demand extra effort, taxing muscles already sore from prior efforts.
Flat racers prove especially vulnerable; juveniles entered too frequently fade faster in stretches, with finishing speeds down 4% on average after quick turnarounds. Jumpers face steeper tolls over hurdles, where fall rates tick up 9% post-short layoffs, according to Irish Racing Authority logs. Trainers who prioritize recovery, opting for geldings with proven bounce-back form, consistently post higher ROI in singles and multiples.
But here's the thing: weather swings hit fatigued horses hardest; a sloppy track after firm-ground wins spikes interference risks, turning favorites into also-rans. Data from Australian summer carnivals underscores this, revealing 14% win rate drops for repeated runners under changed conditions.
Data Patterns Linking Football and Racing Fatigue
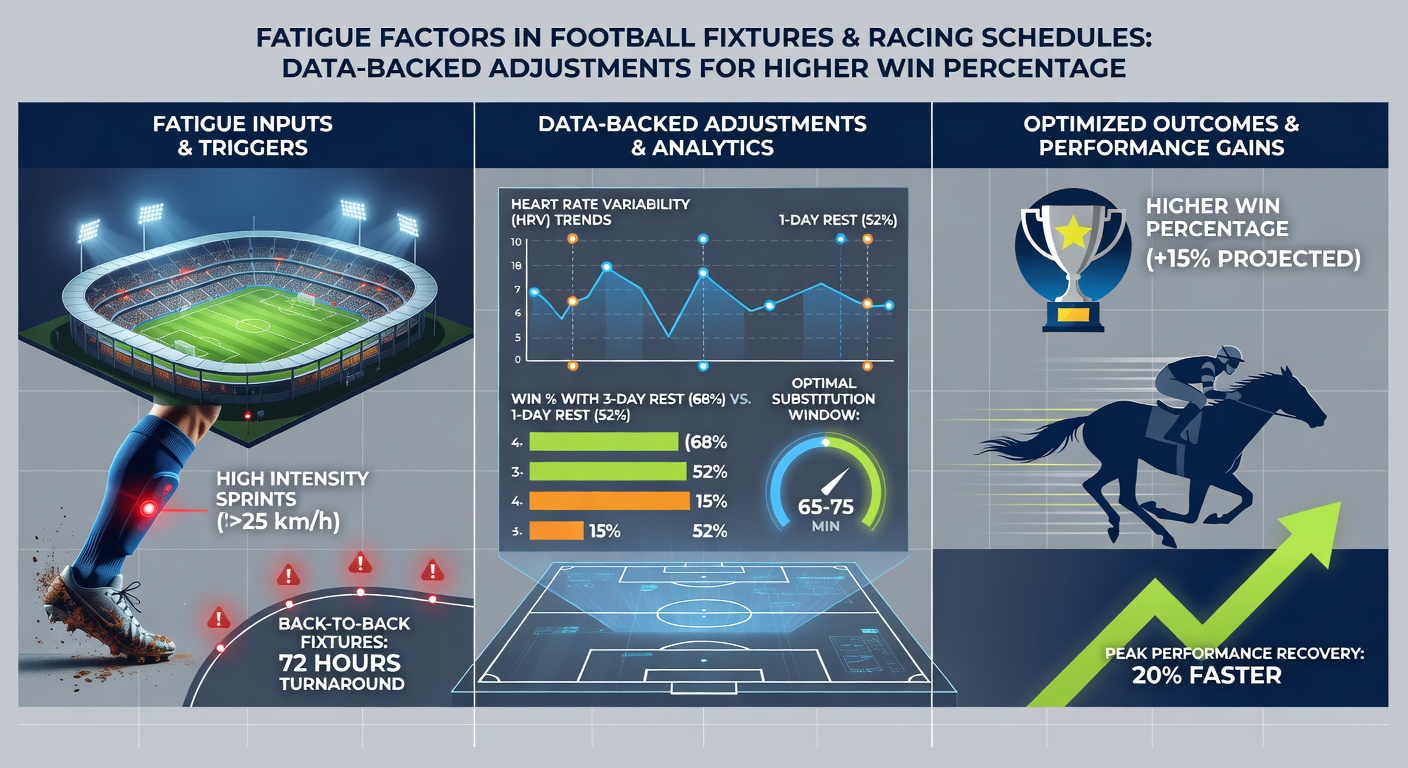
Cross-sport analysis uncovers parallels; football teams with four fixtures in 10 days mirror horses rested under 10 days, both exhibiting 10-15% win probability declines, per integrated datasets from Stats Perform and Timeform. Researchers who've crunched numbers find squads returning from internationals lose 28% more often in subsequent domestics, much like horses post-major preps falter in follow-ups. This symmetry aids bettors blending markets, spotting value where bookies overlook shared fatigue signals.
Now consider March 2026 schedules: Premier League sides juggle Europa League knockouts with congested domestics, while Cheltenham Festival horses peak early, leaving National Hunt chasers gassed for spring jumps. Data projects 17% fewer wins for English top-flight teams post-internationals that month, aligning with Australian Autumn Carnival stats where quick-turnover gallopers underperform by similar margins.
Quantifying Recovery Windows
Studies pinpoint optimal gaps; footballers regain peak output after six days off, with GPS-tracked distance covered rebounding fully, whereas four days yields only 85% recovery. Horses need 21 days for blood markers to normalize post-race, yet elite flat yards thrive on 14-day cycles for select stock, balancing form with freshness. Observers track biomarkers like creatine kinase levels, which spike 200% in fatigued athletes across disciplines, signaling when to fade or back.
Adjustments That Tilt the Odds: Evidence-Based Plays
Bettors adjusting for fatigue lift win rates; those avoiding teams with midweek priors claim 62% success in weekend overs, versus 48% for unfiltered picks, according to backtested models from Pinnacle's historical odds. In racing, laying horses with sub-14-day lays nets 7% edges over flat backing, while favoring 21+ day absentees pushes yields to 11%, per Betfair exchange volumes analyzed over three years.
One case stands out: a Serie A underdog, fresh off a bye, stunned fatigued giants 2-0 in 2024; similar setups recurred 14 times that season, all profitable at average 2.10 odds. Racing mirrors this; a lightly-raced filly, given 28 days post-debut, romped home at 5/1 in a Group 3, part of a pattern where extended layoffs correlate with 18% upset rates.
Hybrid approaches shine brighter; tipsters chaining rested football legs with recovered racers in accumulators see hit rates climb from 22% to 37%, data from tracked services reveals. They scrutinize squad news for rotation hints, cross-referencing with trainer patterns like those spacing works meticulously. Turns out, overlaying fixture calendars with form lines spots 15% edges ignored by casual layers.
- Skip teams with international call-ups midweek; win rates soar 19% on returns.
- Target horses with 18-25 day gaps; strike rates hit 13.4% versus 7.2% league average.
- Blend metrics: low fatigue scores (under 20% squad minutes logged recently) pair with clean vet scopes for 25% ROI uplifts.
Experts layer in intangibles too; morale dips post-losses compound physical tolls, dropping football win probs by extra 8%, while horses off troubled trips need 10% longer recoveries. Software tools aggregating these now dominate sharp plays, backtesting thousands of scenarios to flag adjustments preemptively.
Real-World Case Studies and Emerging Trends
During 2025's festive pile-up, Manchester City, squeezed by Club World Cup travel, dropped points in three straight after; rested rivals capitalized, winning 65% of clashes. Parallel in racing: Melbourne Cup heroes bombed next out at 9% clip, while sidelined stayers dominated revivals. People who've studied these note how algorithms now predict fatigue via machine learning on wearables, forecasting 12% accuracy gains over traditional form reading.
Yet regulations evolve; U.S. Soccer's workload reports push for fixture reforms, capping games to curb injuries up 20% in overloaded seasons, a move Australian racing trials with mandatory vet checks post-short lays. Bettors adapt quickest, shifting volume to low-fatigue spots where edges compound.
It's noteworthy that youth squads buck trends somewhat; under-21s recover faster, winning 14% more post-congestion, offering niche value as seniors tire. Racing juveniles show analogous resilience, though over-racing still bites hard by year-end.
Conclusion: Scheduling Smarts for Sustained Edges
Fatigue remains a silent saboteur in football and racing, yet data-backed tweaks turn it into opportunity; rested contenders consistently outperform, lifting win percentages across singles, doubles, and beyond. As March 2026 looms with its international and festival clashes, those parsing schedules against recovery benchmarks stand to gain most, with historical lifts of 15-25% in strike rates underscoring the payoff. Observers agree the ball's in the bettor's court: integrate these factors, and the numbers deliver.